
What does the expense ratio actually describe?
Many products commonly called spot Bitcoin ETFs in the US are structured as commodity trusts. The SEC’s Bitcoin-and-Ether ETP bulletin distinguishes these products from investment companies registered under the Investment Company Act of 1940 and explains sponsor fees. Check the actual product structure rather than treating every “ETF” label as identical.
Investor.gov’s fund-fee guidance explains that ongoing operating expenses are separate from charges attached to particular investor transactions. For a real comparison, read the current prospectus and fee disclosures. A fee waiver can be conditional or temporary; do not assume an introductory headline lasts throughout your holding period.
This guide isolates the expense calculation. The Bitcoin ETF versus Bitcoin guide addresses the different decision about holding a traded product or direct BTC. Neither fee comparison below is a recommendation to buy a fund.
A transparent fictional fee model
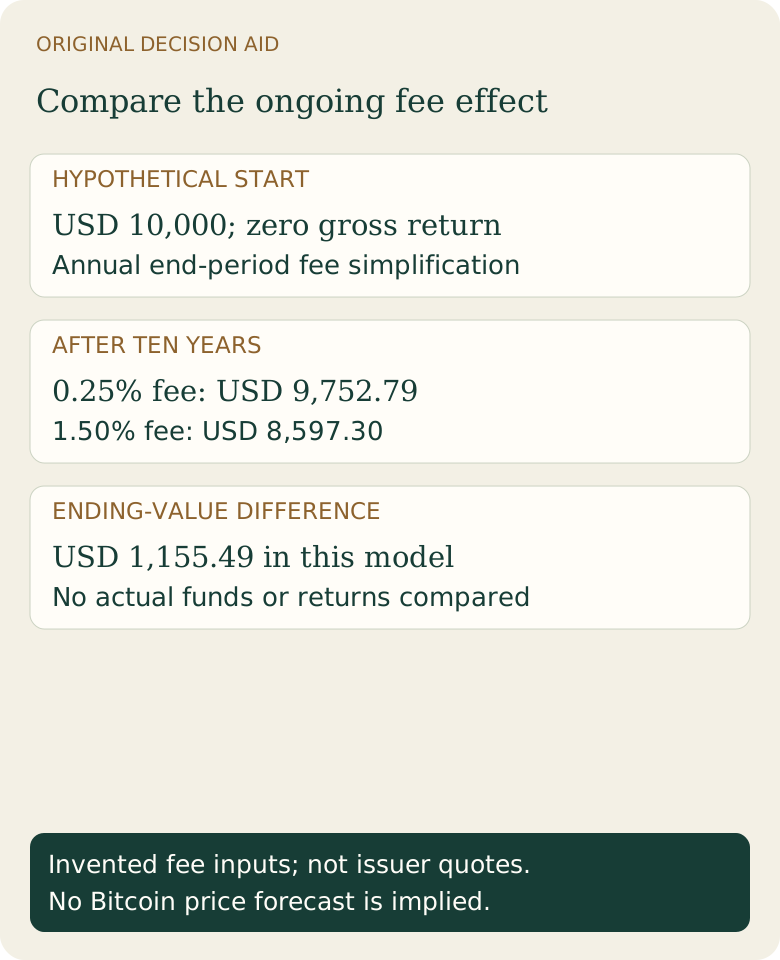
Start with an invented USD 10,000 holding, no contributions or withdrawals and a 0% annual gross return. Compare fictional annual fee rates of 0.25% and 1.50%. For simplicity, apply each fee once at the end of each year to the year’s post-gross-return value.
The formula is ending value = starting value × [(1 + gross return) × (1 − annual fee)] raised to the number of years. A 0.25% input is 0.0025 in the formula. This is an annual teaching model, not a reconstruction of daily fund accounting, an actual fund quote or a forecast.
At 0% gross return, the first-year values are USD 9,975 and USD 9,850. The USD 125 gap is a difference in retained value, not an extra bill. Repeating the same assumed fees for ten years produces the values below, rounded only for display.
Scroll across the table to see all columns.
| Years | 0.25% fee model | 1.50% fee model | Difference in ending value |
|---|---|---|---|
| 1 | USD 9,975.00 | USD 9,850.00 | USD 125.00 |
| 5 | USD 9,875.62 | USD 9,272.17 | USD 603.46 |
| 10 | USD 9,752.79 | USD 8,597.30 | USD 1,155.49 |
Fees matter when the market rises or falls
The same comparison can be repeated with hypothetical constant gross returns of −10%, 0% and +10% each year for ten years. These deliberately simplified paths are sensitivity tests, not possible-return ranges or probabilities. Both models use the same gross return in each row so that their fee input is the difference being studied.
A lower fee preserves more value within this equal-input model, including on a negative path. It cannot prevent a loss from Bitcoin exposure. Real funds can have different trading prices, tracking differences and other costs, so equal assumed gross returns are an analytical control rather than a fact about two products.
Scroll across the table to see all columns.
| Annual gross-return assumption | 0.25% fee model | 1.50% fee model |
|---|---|---|
| -0.10 | USD 3,400.59 | USD 2,997.69 |
| 0 | USD 9,752.79 | USD 8,597.30 |
| 0.10 | USD 25,296.24 | USD 22,299.19 |
What should you compare beyond the headline fee?
Write down the normal fee, any waiver expiry or asset cap, the date of the disclosure and the exact product or share class. If the rate changes during your planned holding period, split the calculation at that point instead of applying the introductory rate to every year.
Separate the ongoing product fee from your broker’s transaction charges and the difference between bid and ask prices. Also distinguish net asset value from the price at which you can actually trade. A low ongoing fee may not dominate a very short holding period if trading costs are substantial.
Scroll across the table to see all columns.
| Input | Where to verify | Why it changes the calculation |
|---|---|---|
| Normal fee | Current prospectus and issuer disclosure | The recurring baseline may differ from a promotion |
| Waiver terms | Expiry, asset cap and conditions | An introductory fee may end |
| Trading cost | Broker schedule and current spread | Not the same as the ongoing fee |
| Structure and tracking | Product documents and methodology | Equal market exposure cannot simply be assumed |
| Holding period | Your own scenario | One trade and a decade have different cost weights |
Reproduce the calculation before comparing products
Download the original fee-comparison worksheet. It provides the formula, unrounded decimal results, invented inputs and excluded costs. It does not contain live fund rankings, current issuer rates or a Bitcoin-price prediction.
Fiat2Bitcoin does not sell ETF shares or provide brokerage accounts. For a separate direct-BTC purchase question, review purchase methods, purchase costs and custody responsibilities. Direct BTC also has costs and risks; the fund fee alone is not a complete comparison.
Is the expense ratio a separate annual invoice?
The model shows its effect on retained value. Actual product documents explain how expenses are accrued and paid; brokerage charges and other costs remain separate.
Are 0.25% and 1.50% current fund quotes?
No. Both are invented comparison inputs. Verify any real product’s current fee, structure and waiver conditions in its disclosure.
Does the calculation predict Bitcoin returns?
No. Its gross-return paths are hypothetical controls used to isolate fee effects, with no probabilities or forecasts assigned.
Sources & further reading
These sources explain the payment systems and rules discussed in this guide. For your purchase, check the provider’s current offer and terms.
- SEC Investor.gov: spot Bitcoin and Ether ETPs
- SEC Investor.gov: fund fees and prospectus expense tables
Original reproducible decimal fee model using invented rates and constant-return scenarios. No actual fund performance, daily accounting or investment forecast is claimed. How we prepare our guides.