
What period and source does this review cover?
This retrospective was prepared on November 18, 2026 and covers June 1–30, 2026 in UTC. The data source is the Alternative.me Crypto Fear & Greed Index API. We filtered its timestamped daily records into that calendar month; we did not copy the current widget and describe it as a June value.
Alternative.me describes its index as a 0–100 sentiment measure and says its current index is for Bitcoin. Its methodology discusses volatility, momentum/volume, social activity, dominance and search trends, with surveys marked paused on the page we retrieved. That description is not evidence that the precise calculation or every input was unchanged throughout June.
The title says Bitcoin market sentiment because the underlying measure is Bitcoin-focused. It is not an average across every cryptocurrency, a poll of all holders, an ETF-flow total, or the percentage of investors who were afraid. The provider’s labels are retained as supplied.
What do the 30 daily observations show?
Data source: Alternative.me. The table below contains Fiat2Bitcoin’s calculations from the retrieved June daily records. Index values are unitless scores out of 100, not dollar prices or investment returns.
Scroll across the table to see all columns.
| Measure | Result | Definition |
|---|---|---|
| Coverage | 30 of 30 UTC calendar days | Exactly one retrieved record for each June date |
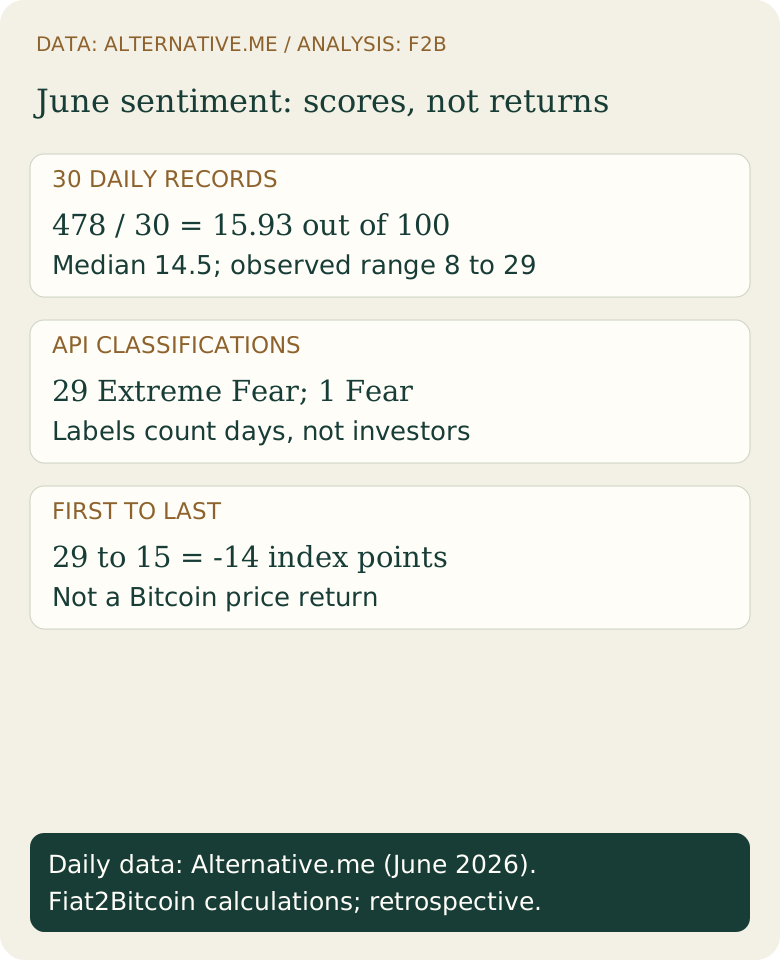
| Sum of daily scores | 478 | Add all 30 daily values |
| Arithmetic mean | 15.93 / 100 | 478 ÷ 30 = 15.9333…; rounded to two decimals |
| Median | 14.5 / 100 | Average of the 15th and 16th sorted values: (14 + 15) ÷ 2 |
| Minimum | 8 on June 8 | Lowest observed daily score |
| Maximum | 29 on June 1 | Highest observed daily score |
| Provider classification | 29 Extreme Fear; 1 Fear | Count the API labels without relabeling the daily records |
| First to last | 29 → 15; −14 index points | June30 score minus June1 score |
Why is the monthly average not the whole story?
Daily data: Alternative.me; interpretation and arithmetic: Fiat2Bitcoin. The month began at 29 on June 1, fell to 8 on June 8, and ended at 15 on June 30. The minimum-to-last difference was +7 points, while the first-to-last difference was −14 points. Both statements are true because their starting dates differ.
A score average of 15.93 compresses that path into one number. It does not mean the index stood at 15.93 every day. Nor does the move from 8 to 15 show that Bitcoin’s dollar price rose, that an investment recovered, or that the same buyers changed their opinions.
The index was labeled Extreme Fear on 29 of the 30 retrieved days: 29 ÷ 30 × 100 = 96.67% of the observations, rounded. That is a share of daily records, not 96.67% of people or invested capital. The remaining record, June 1, was labeled Fear.
Scroll across the table to see all columns.
| UTC date | Score /100 | API classification |
|---|---|---|
| 2026-06-01 | 29 | Fear |
| 2026-06-08 | 8 | Extreme Fear |
| 2026-06-16 | 23 | Extreme Fear |
| 2026-06-23 | 23 | Extreme Fear |
| 2026-06-30 | 15 | Extreme Fear |
How can you reproduce the calculation?
Download the June daily records and calculation receipt. Daily data are attributed to Alternative.me beside the dataset; the file includes the source endpoint, retrieval date, timestamps, UTC dates, scores, supplied labels and calculation definitions. No customer or trading-account records are included.
Convert each Unix timestamp to a UTC date. Keep dates greater than or equal to June 1, 2026 and earlier than July 1, 2026. Sort by date, reject duplicate dates, and verify that the date list contains all 30 days. Converting to a local timezone first can shift a midnight UTC record into the previous calendar date.
Add the integer scores and divide by 30 for the arithmetic mean. For the median, sort scores numerically and average positions 15 and 16, counting the first position as one. Count the API’s classification strings separately. An average score should not be substituted for the count of actual daily labels.
These are calculations on the retrieved archive, not an independent reconstruction of Alternative.me’s underlying model. If the provider later revises historical data, a fresh download may differ. This receipt preserves the snapshot used for this article.
Does a report titled June necessarily measure June?
No. The first-party Bitwise report titled “From Sovereign Stress to Monetary Support,” presented as its June 2026 Bitcoin Macro Investor, discusses May 2026 performance in its summary. A publication month and a measurement month can be different.
When comparing that kind of commentary with a June daily index series, record both the report’s issue date and the actual period described. Do not relabel a May performance discussion as a measured June return. This article does not use that commentary as a substitute for the 30 dated index records.
What should a buyer avoid concluding from these numbers?
A low sentiment reading does not establish a bargain, a bottom, an expected return or permission to take more risk. A unitless index-point change is not a Bitcoin percentage return. Calculating a return would require a separate, defined price series, time convention and treatment of costs.
This review does not test whether the index predicts future prices. It contains no backtest, trade execution, causal attribution or recommendation to buy or sell. It cannot tell you why a particular person traded or whether an account purchase would be accepted.
For an actual purchase decision, separate sentiment from the amount you can afford to risk, provider eligibility, total fees and receiving requirements. Our purchase-fee guide, dollar-cost averaging guide and Bitcoin versus ETF guide address those different questions. None turns this historical index into a guaranteed outcome.
Sources & further reading
These sources explain the payment systems and rules discussed in this guide. For your purchase, check the provider’s current offer and terms.
- Alternative.me: index scope, methodology and attribution rules
- Alternative.me: daily historical API
- Bitwise: June2026 publication discussing May performance
Daily historical index data: Alternative.me, retrieved November 18, 2026. Calculations and interpretation: Fiat2Bitcoin. These are actual archived index observations, not fictional prices, current quotes or customer transactions. How we prepare our guides.